你的票,看似一周没动,其实走过了千山万水· 8.3-8.7 本周回顾
本周挂出去的判断,全部开了奖。 两条事前冻结的区间都兜住了闪迪的财报结果;SPCX 跌 13.61% 的那一天,仍然待在前一天就画好的区间里。这一周我们一次方向都没押,押的全是范围和去向。
三家周四收在同一种位置上:贴着行权价。 美光距 900 差 18.53、特斯拉距 320 差 0.47、英伟达距 220 差 1.01。周五收盘,特斯拉和英伟达穿了过去,美光反向走开。
一 · 本周回顾:挂出去的账,回来对
一句话:事前写下的区间,价值不在于它猜对了,在于它写下之后不能改。
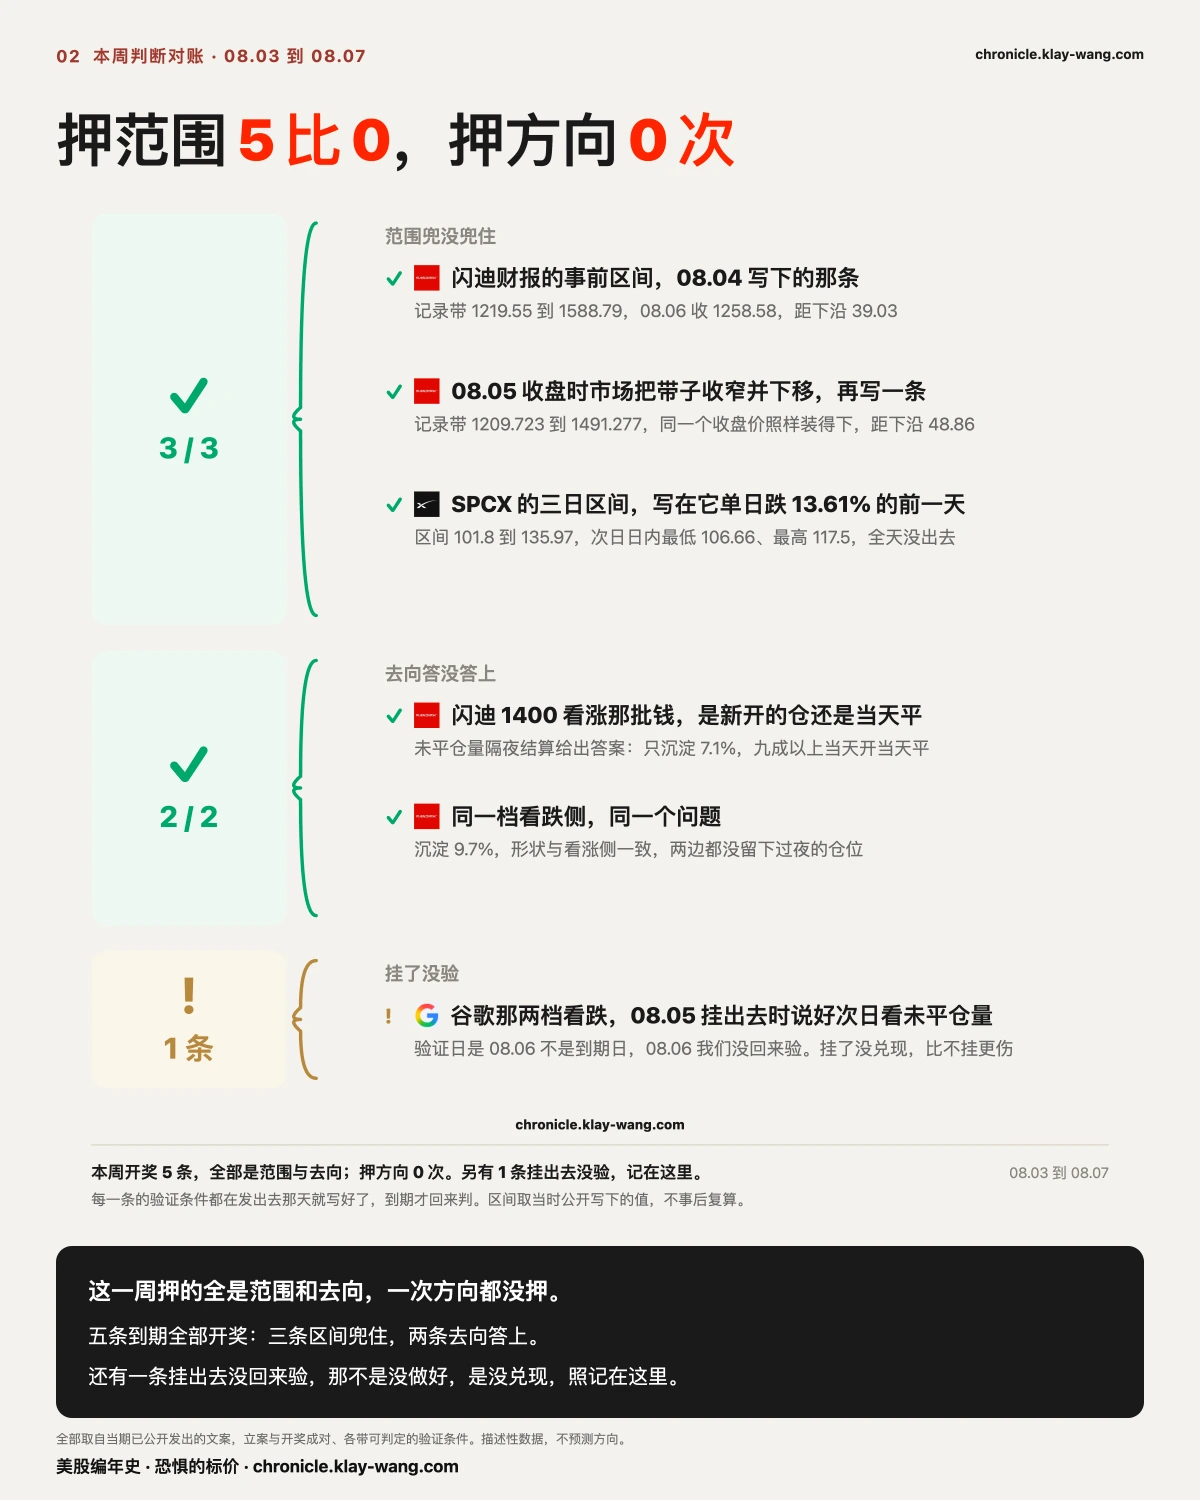
闪迪的两条带都兜住了。 08.04 收盘时记录的区间是 1219.55 到 1588.79;08.05 收盘时市场把带子收窄并下移,记成 1209.723 到 1491.277。财报之后,08.06 收在 1258.58,两条带都装得下它,距 08.04 那条的下沿 39.03 美元,距 08.05 那条 48.86 美元。
值得记的是两条带的变化方向:随着股价从 1425 走到 1350 进入财报,市场把带子收窄了,也把整条带往下挪了。它不是一直开着同一个价在等,它每天都在改,而每次改都留了痕。
SPCX 那条更极端。 08.04 收盘给出的三日区间是 101.80 到 135.97。第二天它跌了 13.61%,日内最低 106.66、最高 117.50,全天都在那个区间里面。跌这件事本身,前一天就已经被算进价钱里了。
闪迪 1400 那一档的钱,两侧都没留下。 08.05 成交的合约里,看涨侧沉淀 7.1%、看跌侧 9.7%,两边都是九成以上当天开当天平。那批钱不是压着过夜的仓位,是当天来当天走的。
记分牌一句话:这一周押的全是范围和去向,一次方向都没押,五条全开了奖。
二 · 市场自己定的范围,也回来对了
一句话:不只我们挂的判断要回来对,市场自己用钱定的范围,同样可以对。
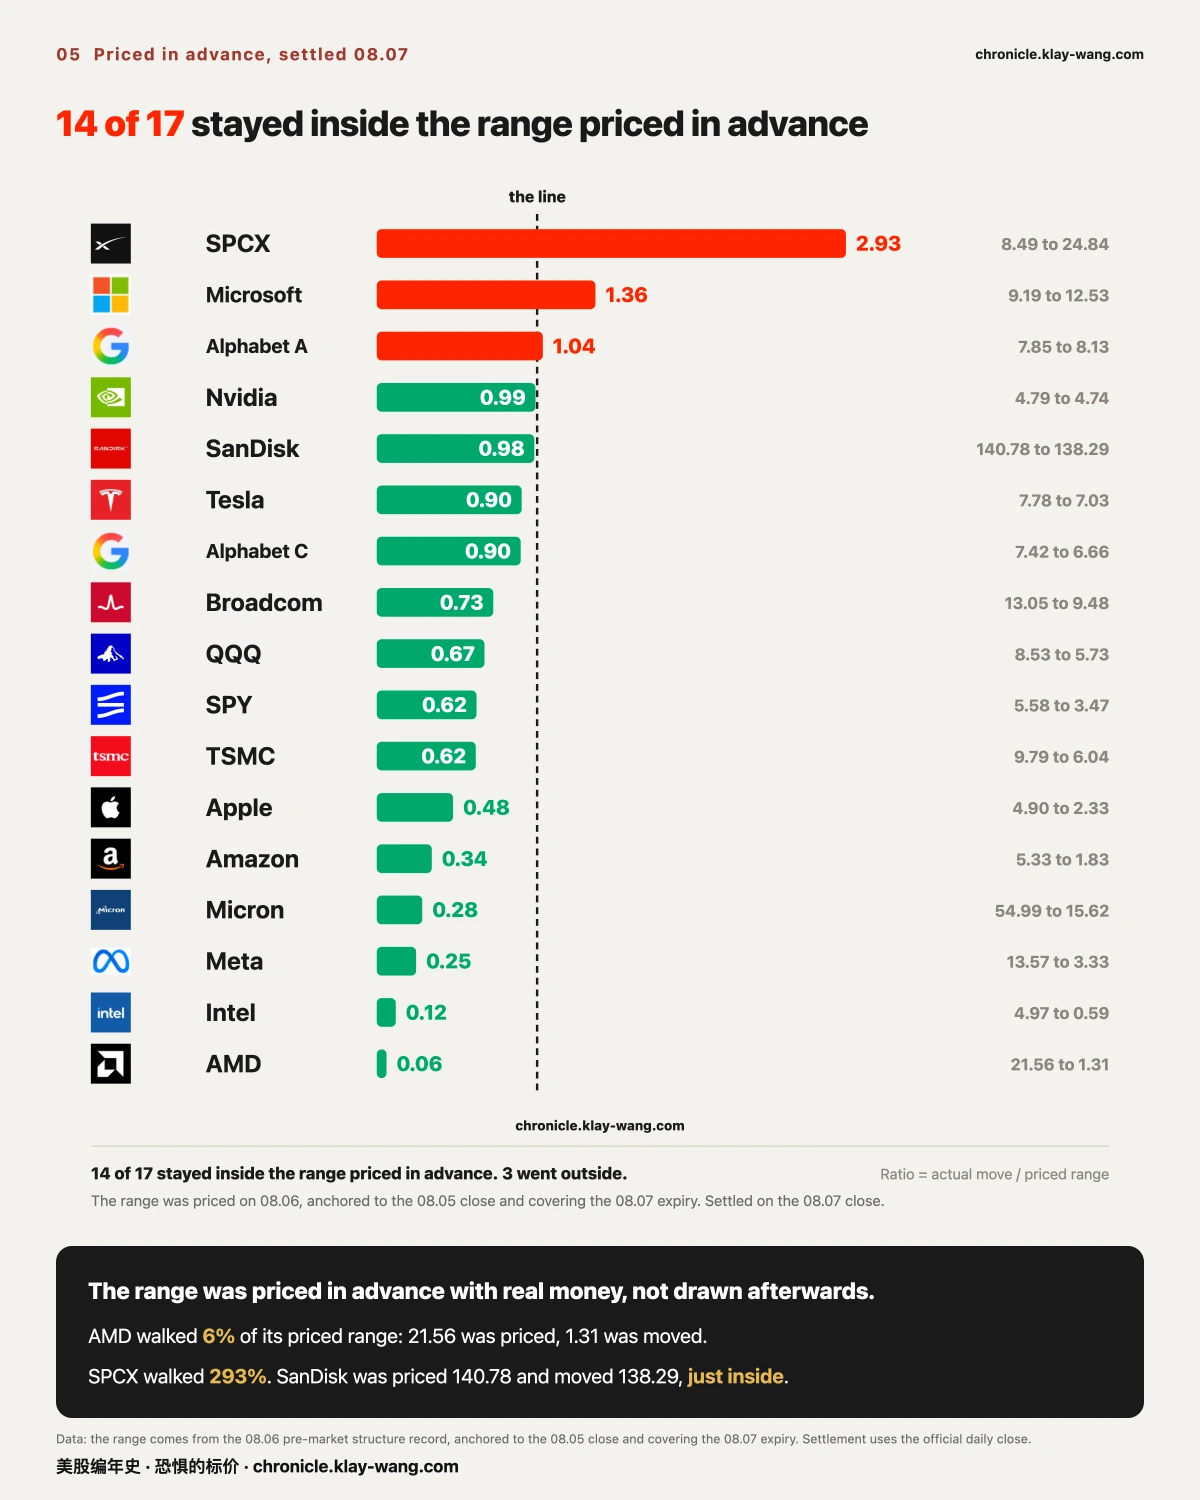
08.06 那天,市场给 17 只观察标的各定了一个到 08.07 到期前的波动范围。08.07 收盘开奖:
17 只里 14 只留在范围内,3 只走了出去(SPCX、微软、谷歌A)。
两头都很极端:AMD 只走了定价范围的 6%:给它定了 ±21.56,它动了 1.31;而 SPCX 走了 293%。闪迪最惊险,定 ±140.78 走了 138.29,擦着边没出去。
口径:范围是 08.06 盘前定的,上下沿锚 08.05 收盘、覆盖到 08.07 到期;开奖取 08.07 收盘。
三 · 你惦记的存储,看着一周没动,其实走过了千山万水
一句话:你惦记的那几只存储,一周下来涨跌多少,和这一周晃了多大,是两件事。
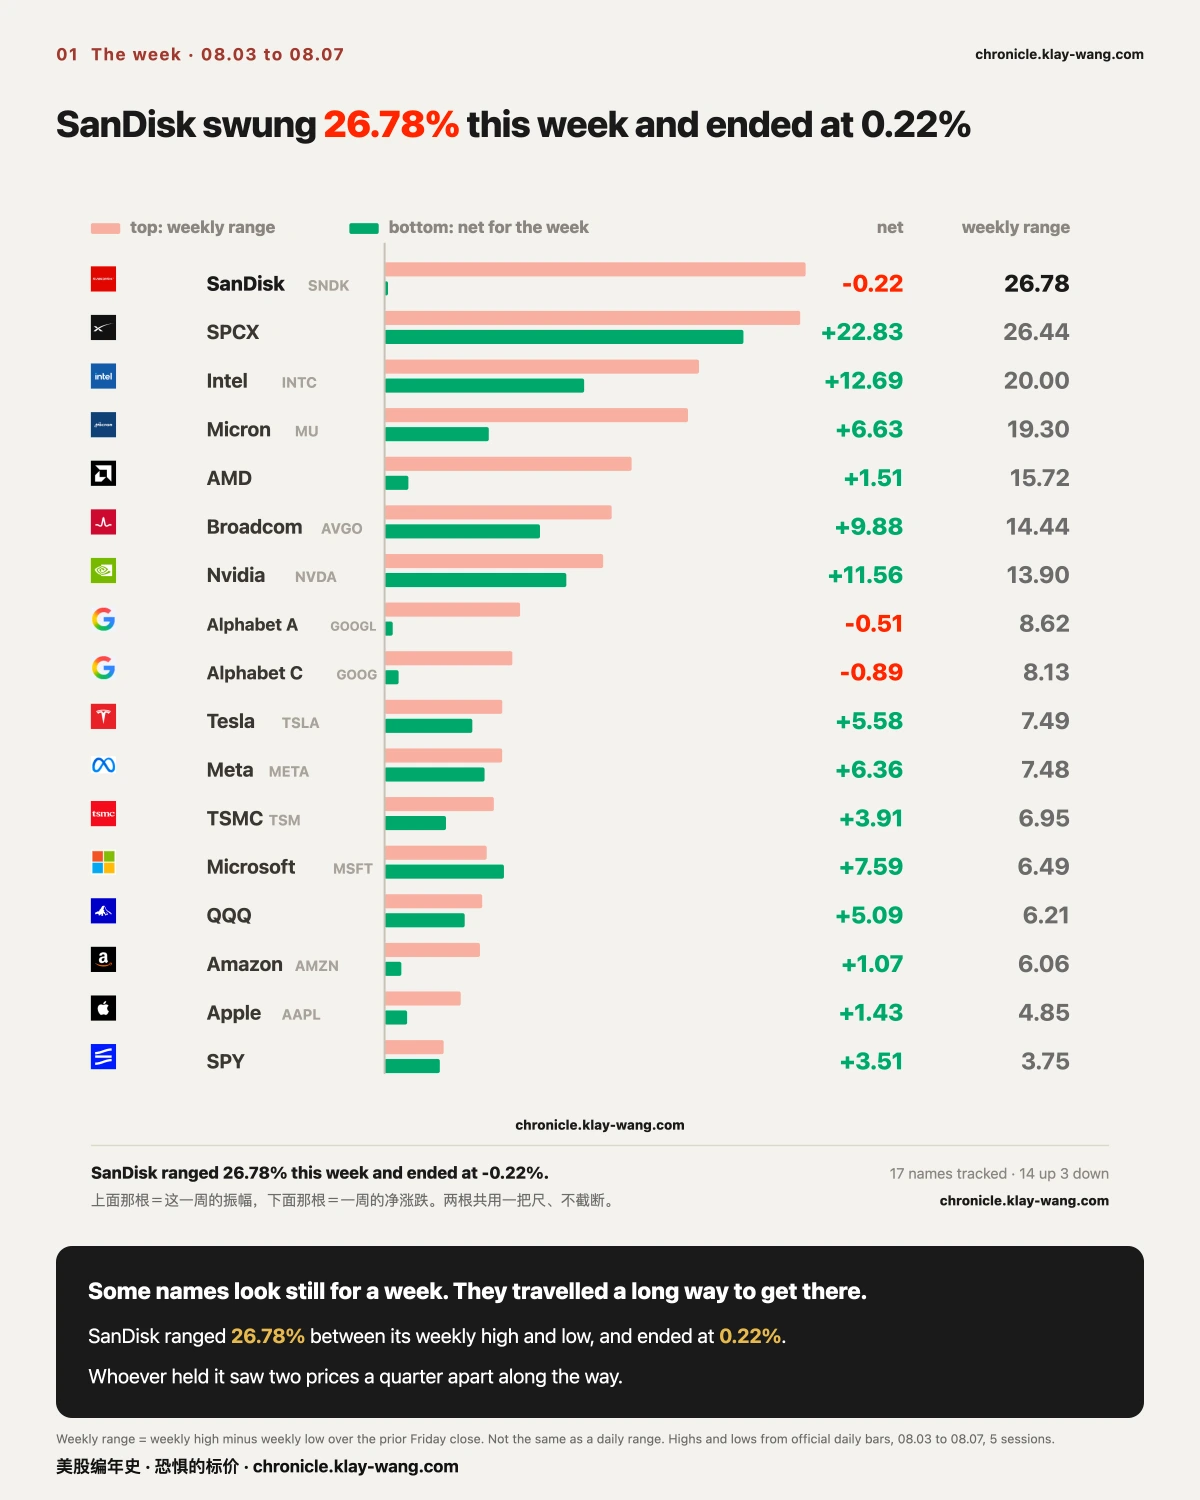
十七只观察标的,这一周 14 涨 3 跌。但把周振幅(周内最高减周内最低,除以上周五收盘)和一周净涨跌并排放,落差立刻出来:
| 票 | 这一周振幅 | 一周净涨跌 |
|---|---|---|
| 闪迪 | 26.78% | −0.22% |
| SPCX | 26.44% | +22.83% |
| 英特尔 | 20.00% | +12.69% |
| 美光 | 19.30% | +6.63% |
| AMD | 15.72% | +1.51% |
| 大盘 SPY | 3.75% | +3.51% |
前四名全是半导体与存储,而大盘只有 3.75%,晃得最狠的和最稳的差七倍。
闪迪是最极端的那个:周内最高到过 1446.62、最低跌到 1121.27,差 26.78%,而一周下来只动了 0.22%。逐日看是 +6.03、+10.84、−5.40、−6.81、−3.68,先冲上去,再一路还回来。
SPCX 是同样的幅度,完全不同的结果:振幅 26.44% 跟闪迪几乎一样,但它一周净涨 22.83%,晃出去了,没回来。
同样是两成六,一个是白折腾,一个是真涨。
反过来,英伟达周振幅 13.90% 而净涨 11.56%,它这一周走的每一步几乎都朝着同一个方向。
这也是为什么周线图会骗人。 它只画起点和终点,中间那 26.78 个百分点的往返,在图上一个像素都不占。
拿住闪迪的人,中间见过相差四分之一的两个价格。
这张表对拿着票的人意味着什么。 振幅不是一个抽象数字,是账户里真实出现过的两个余额:拿着闪迪的人,这一周账面见过 1446 也见过 1121,最后停在原地;拿着 SPCX 的人见过同样大的摆动,但终点在高处。两件事的差别不在幅度,在筹码有没有换到新的共识价位。闪迪从 1121 到 1446 都有人真金白银成交,说明财报之后,市场对它值多少钱的分歧宽到了四分之一个股价;分歧这么宽,来回就不会停。SPCX 的摆动是单向的,价格走到新位置就没回去,那是共识在搬家。
本节的判断:闪迪这种高振幅、零净变的形状,说明财报没有制造共识,只制造了换手。 分歧要么被下一个数据收敛,要么继续来回摩擦。
推翻条件:下周它的周振幅缩到本周一半以下、且价格站稳一侧,说明分歧已收敛,本条作废。
口径:周振幅=周内最高减周内最低,除以上周五收盘,与当日振幅不是一回事。 高低价取自官方日线。
四 · 温度计:保险在变便宜,而便宜的是近的那一头
一句话:这个数字不是给买保险的人看的,是给卖保险的人开的价。
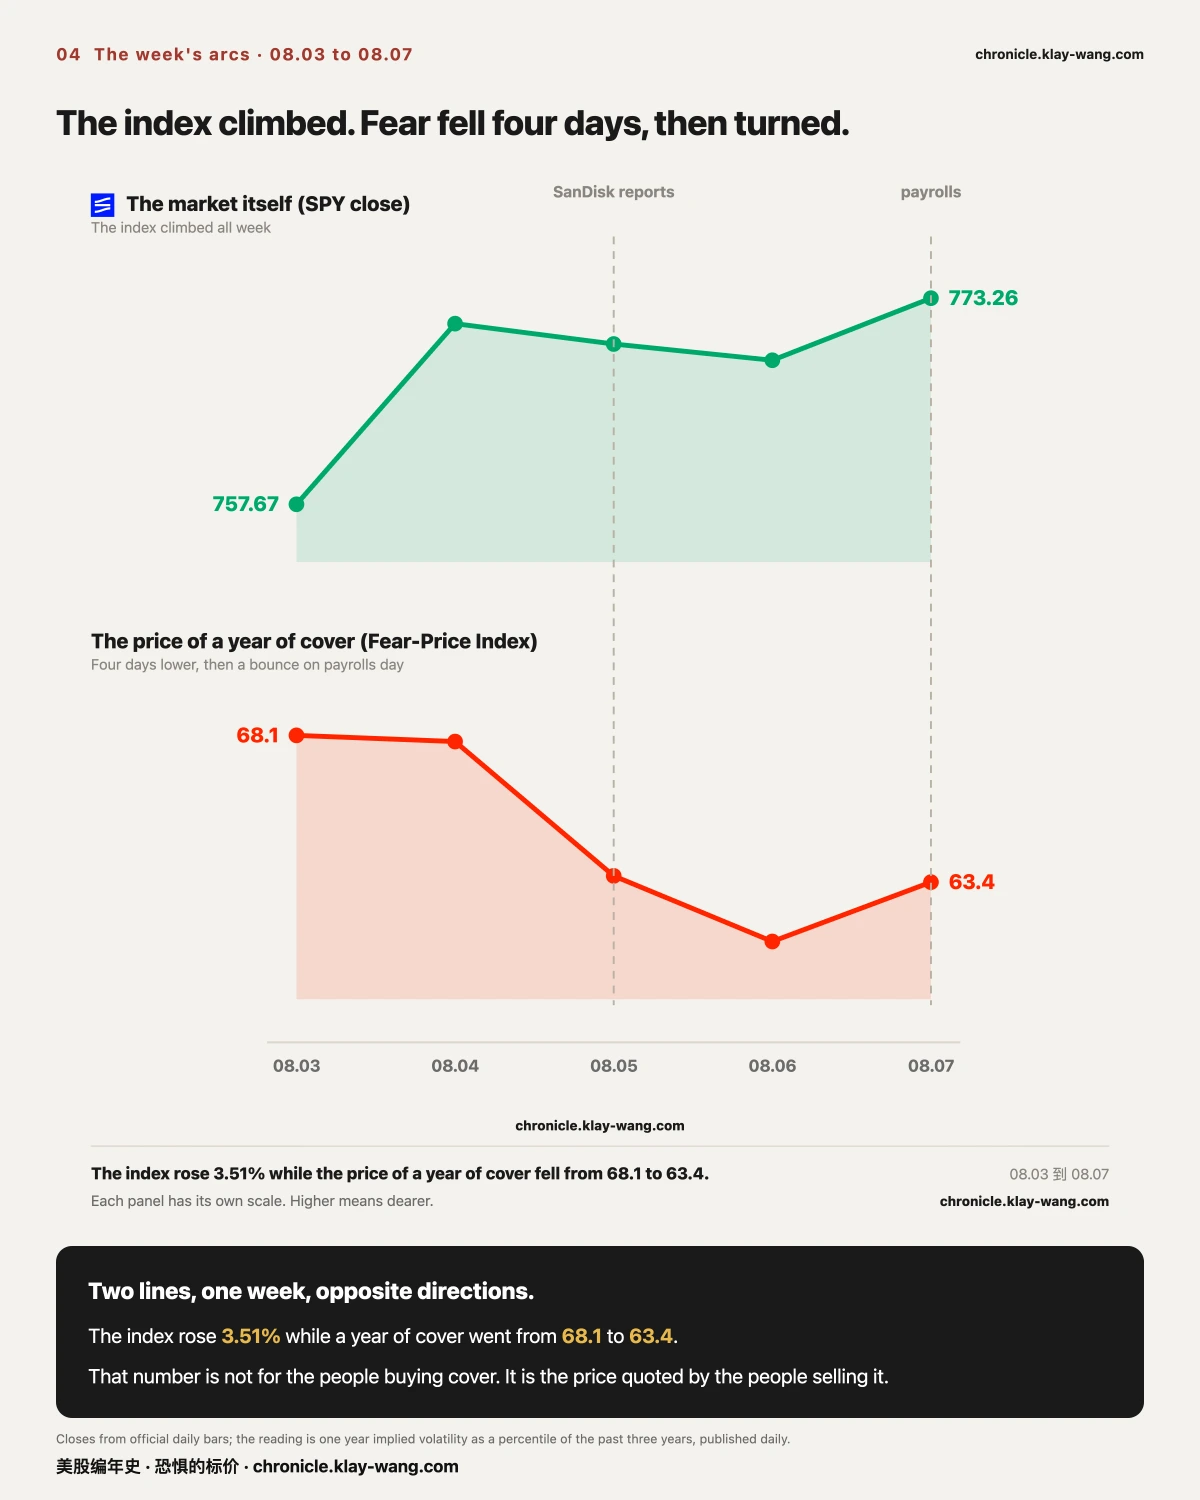
恐惧的标价指数这一周降了四个交易日,非农那天回了一下:08.03 读数 68.1,08.04 是 67.9,08.05 降到 63.6,08.06 是 61.5,08.07 回到 63.4。一年期波动率 VIX1Y 从 22.90 到 22.66。
我有个恐惧温度计,量的就是市场现在花多少钱给未来一年买保险。保险越贵,说明市场越怕。 63.4 分的意思是,贵到过去三年的前 37%。
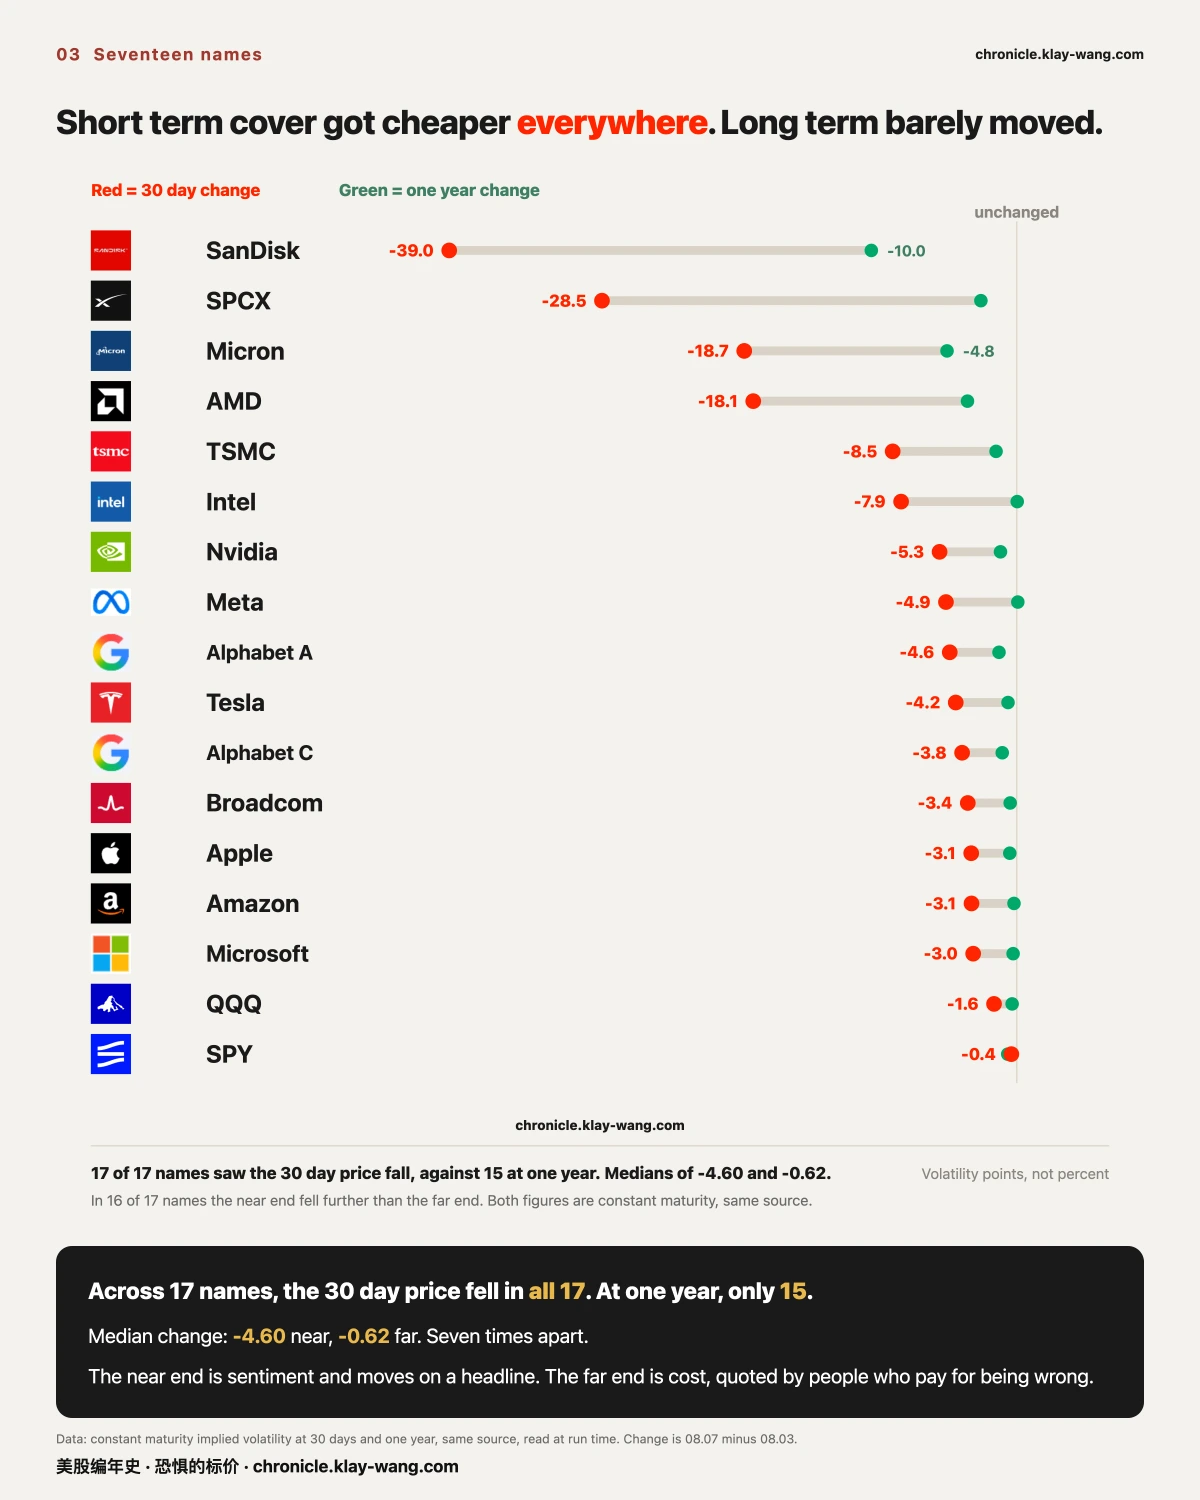
但拆开看更有意思。这一周 17 只观察标的,30 天的保险价一只不落全降了,而一年期只有 15 只降。 变化的中位数,近端是 −4.60,远端只有 −0.62,差着七倍。17 只里有 16 只,近端降得比远端多。
降得最狠的是闪迪:30 天从 130.45 砸到 91.49,一周掉了 38.96 个点,而它的一年期只降 9.98。财报开完了,那个不确定性没了,短期保险立刻不值钱;但一年之后会怎样,没人因为一份财报就改口。
口径:两个数同源,都是恒定期限值,变化量=08.07 减 08.03。
近端是情绪,一条新闻就能跳;远端是成本。 做市商必须给一年后报价,他不猜方向,只算承担这个风险要收多少才不亏。所以远端动得慢:一份财报改不了他对一年的看法。
对拿着正股的人,这条曲线的两端是两笔不同的账。 近端塌了 38.96 个点(闪迪),意味着给持仓买一个月的保护,周五比周一便宜了三成以上;同一个人若在卖备兑收租,能收到的租金也同步薄了三成。保险变便宜和租金变薄是同一件事的两面,取决于站在哪一边。 而远端几乎没动,意味着市场只认为这一件事出清了,没有认为这只票从此安静了。
本节的判断:这一周的降温是事件出清,不是整体撤防。 判据就在期限结构上:真正的恐惧消退应该两端一起降,而本周只有近端塌。
推翻条件:下周一年期那端补跌超过 2 个点,说明市场在整体下调长期风险的定价,本条改判。
它不告诉你下周涨跌,它告诉你,那批必须给未来一年报价、并且要为报错付钱的人,这一周把价钱调低了。
把这一周的两条线并排看,方向是反着的:指数一路往上,而给未来一年买保险反而越来越便宜。
五 · 一只票吃掉全周的三分之一
一句话:这一周异常成交的钱,三分之一压在同一只票上。
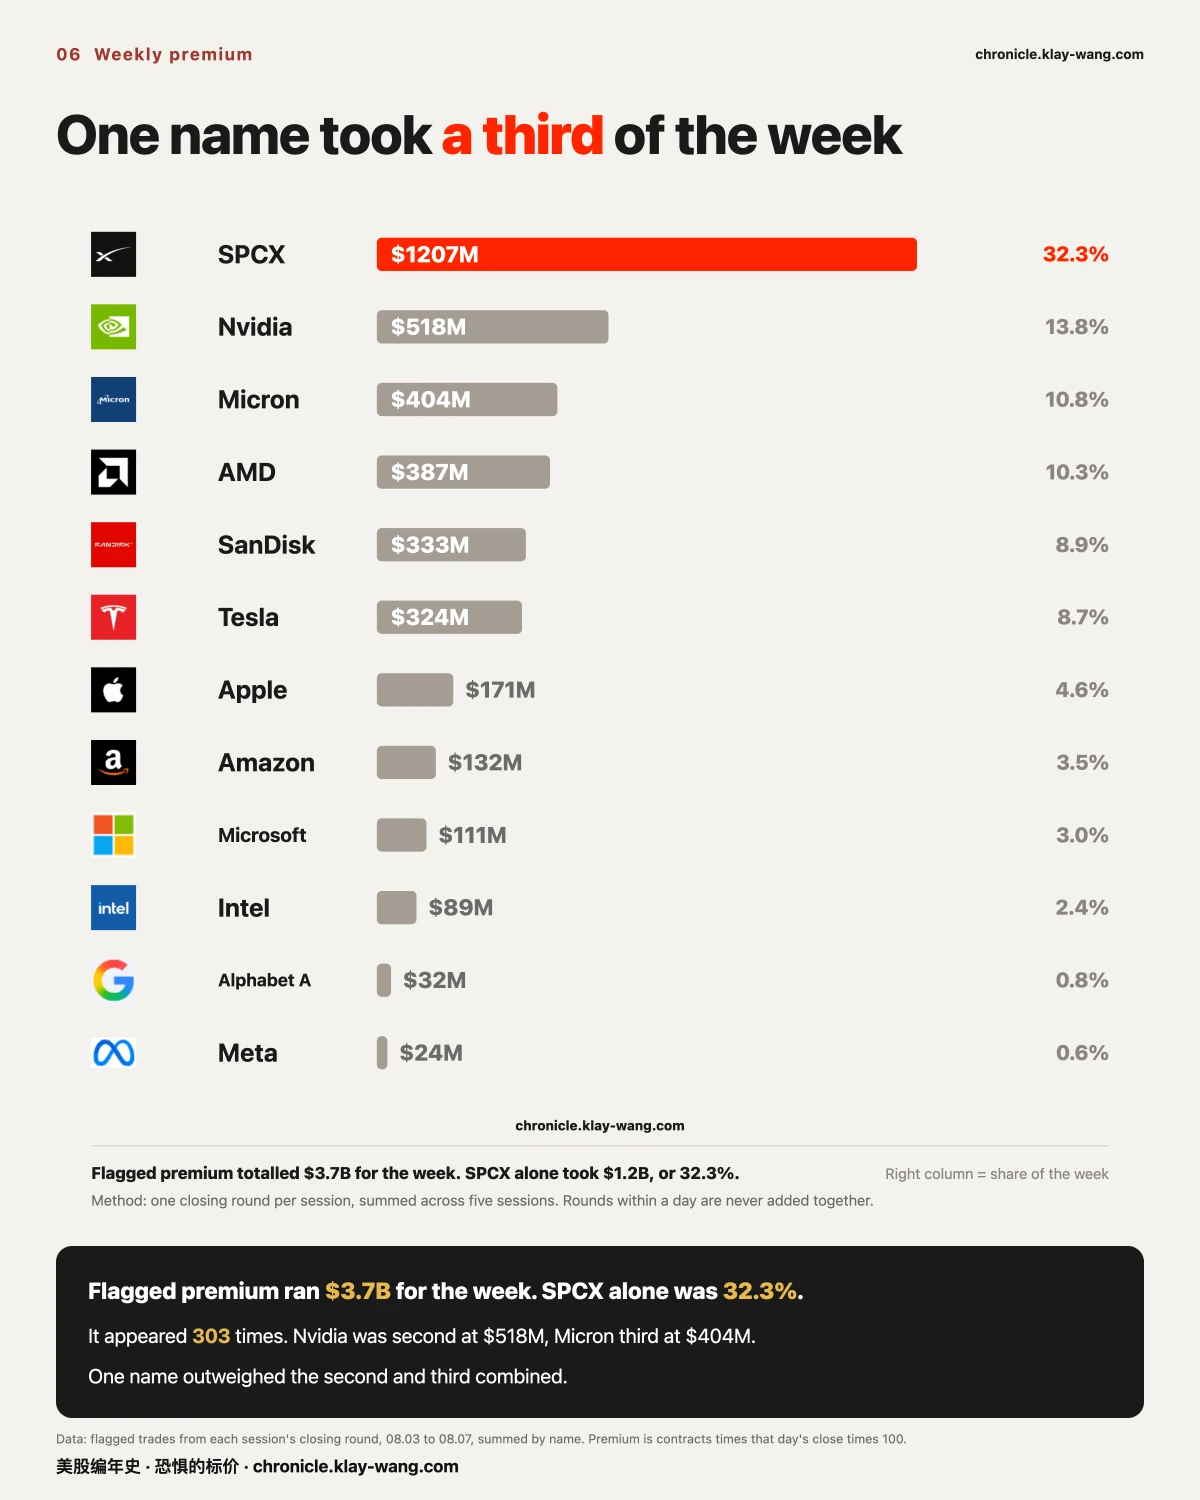
全周异常成交的权利金合计 37.4 亿美元,SPCX 一只占 12.1 亿,32.3%,上榜 303 条。第二名英伟达 5.2 亿,第三名美光 4.0 亿。一只票的分量超过第二三名加起来。
一只票占三分之一,对不同的人是两件不同的事。 拿着 SPCX 的人,持有的是全场期权定价最贵的注意力:那 12.1 亿权利金绝大多数押在下周四到期,意味着未来五个交易日,它的每一次波动都会被期权对冲放大,涨和跌都比别的票用力。拿着其他票的人也有一笔账:异动榜被一只票占掉三分之一时,剩下十六只的动静只分享三分之二的注意力,本周美光 900 那档、特斯拉相邻两档的新建,就是在这种阴影里发生的。
本节的判断:集中度本身就是信息。 37.4 亿里 32.3% 压在一只票上,说明的不是市场看好谁,是市场把波动的预算花在了哪。
推翻条件:下周 SPCX 占比回落到 15% 以下而总盘子不缩,说明这只是解禁周的特例;若总盘子跟着一起缩,说明这一周的热闹本来就是它一家的。
口径:每个交易日只取收盘那一轮,五天相加。同一天的多轮绝不相加,做市商倒手会被重复计。
我们把含义摆全。看懂之后怎么动,是每个人自己的账。
六 · 下周看点:钱怎么表态
下周三件事挤在一起:08.12 消费者物价指数、08.13 生产者物价指数、08.14 密歇根消费者信心初值。
三件事全部落在 08.14 到期那一批合约的寿命之内。也就是说,这一批合约要同时为三个数字定价,而它们只有一次结算机会。08.07 收盘时市场为那一档开的价,就是它对这三件事加起来有多大把握的报价。
08.19 是波动率期货近月到期日,从下周起近月进入最后两周。曲线形状再变,就不能只归因于情绪了,滚动效应要一起算进去。
期权异动与逐票数据 → https://chronicle.klay-wang.com/options
温度计读数与两个台账 → https://chronicle.klay-wang.com
这两页每个交易日收盘后自动更新,页上带日期,改不了也补不回去。
English edition
Subject line
The stock you keep watching went nowhere. It travelled a very long way.
Three lines
- Some names look like they went nowhere for the week. They travelled a very long way. SanDisk finished the week −0.22%, essentially back where it started, while its weekly high and low were 26.78% apart. Anyone reading only the weekly bar sees a stock that never moved.
- Every judgment we posted this week settled. Both pre-frozen ranges contained SanDisk's earnings result, and on the day SPCX fell 13.61% it stayed inside the range drawn the session before. We did not bet on direction once this week. Every bet was on range and on outcome.
- Three names closed Thursday in the same kind of place: right against a strike. Micron stood 18.53 from 900, Tesla 0.47 from 320, Nvidia 1.01 from 220. By Friday's close, Tesla and Nvidia crossed, and Micron moved the other way.
1. The week in review: the accounts we posted, settled
In one line: the value of a range written in advance is not that it was right, it is that it cannot be changed afterwards.
Both SanDisk bands held. The range recorded at the 08.04 close was 1219.55 to 1588.79. At the 08.05 close the market narrowed the band and moved it down, to 1209.723 to 1491.277. After earnings, 08.06 closed at 1258.58, inside both, 39.03 above the lower edge of the first and 48.86 above the second.
What is worth logging is the direction of the change. As the stock walked from 1425 down to 1350 into earnings, the market narrowed the band and moved the whole thing lower. It was not holding one quote and waiting. It revised daily, and every revision left a trace.
SPCX was more extreme. The three day range given at the 08.04 close was 101.80 to 135.97. The next day it fell 13.61%, with an intraday low of 106.66 and a high of 117.50, inside that range all session. The fall itself had already been priced the day before.
On SanDisk's 1400 strike, the money stayed on neither side. Of the contracts traded on 08.05, 7.1% stuck on the call side and 9.7% on the put side. Over ninety percent, both sides, opened and closed the same day. That money was not a position held overnight. It came and went within the session.
The scoreboard in one line: every bet this week was on range and outcome, never once on direction, and all five settled.
2. The range the market set for itself also came back to be settled
In one line: it is not only our own posted judgments that get settled. The range the market priced with real money can be settled too.
On 08.06 the market set a move range for each of 17 watched names, running to the 08.07 expiry. At the 08.07 close:
14 of 17 stayed inside the range. 3 went outside (SPCX, Microsoft, Alphabet A).
Both tails are extreme. AMD walked just 6% of its priced range: ±21.56 was priced, 1.31 was moved. SPCX walked 293%. SanDisk came closest of all, priced ±140.78 and moving 138.29, just inside.
Method: the range was priced pre-market on 08.06, anchored to the 08.05 close and covering the 08.07 expiry. Settlement uses the 08.07 close.
3. The memory names looked still. They travelled a very long way
In one line: how much a name finished up or down for the week, and how far it swung during it, are two different things.
Across 17 watched names, 14 rose and 3 fell. But put the weekly range (weekly high minus weekly low, over the prior Friday's close) beside the net change for the week, and the gap is immediate:
| Name | Weekly range | Net for the week |
|---|---|---|
| SanDisk | 26.78% | −0.22% |
| SPCX | 26.44% | +22.83% |
| Intel | 20.00% | +12.69% |
| Micron | 19.30% | +6.63% |
| AMD | 15.72% | +1.51% |
| SPY | 3.75% | +3.51% |
The top four are all semis and memory, while the index moved just 3.75%. The widest swinger and the calmest are seven times apart.
SanDisk is the extreme case. It reached 1446.62 and fell to 1121.27, a 26.78% spread, and finished the week 0.22% from where it began. Day by day: +6.03, +10.84, −5.40, −6.81, −3.68. Up first, then all the way back.
SPCX had the same amplitude and a completely different result: a 26.44% range, almost identical, but up 22.83% net. It swung out and did not come back.
Same twenty six percent. One was churn, one was a real move.
The other way round, Nvidia ranged 13.90% and finished up 11.56%:nearly every step it took that week pointed the same way.
This is why a weekly chart misleads. It draws the start and the end. Those 26.78 points of round trip in between take up not a single pixel.
Anyone who held SanDisk saw two prices a quarter apart along the way.
What this table means for anyone holding these names. Range is not an abstract number. It is two balances that actually appeared in the account: whoever held SanDisk saw 1446 and saw 1121 and ended where they started, while whoever held SPCX saw a swing just as wide and ended higher. The difference is not amplitude. It is whether the shares changed hands into a new consensus price. SanDisk traded real money everywhere from 1121 to 1446, which means post earnings disagreement about what it is worth spans a quarter of the share price, and disagreement that wide does not go quiet. SPCX's swing was one way: price moved to a new place and stayed. That is consensus relocating.
The judgment of this section: SanDisk's high range, zero net shape says earnings manufactured turnover, not consensus. Either the next data point closes that gap, or the round trips continue. Void if: next week its range halves and price holds one side. Then the disagreement has resolved and this reading retires.
Method: weekly range equals weekly high minus weekly low, over the prior Friday's close. It is not the same as daily range. Highs and lows come from official daily bars.
4. Thermometer: insurance got cheaper, and the cheap end is the near one
In one line: this number is not for the people buying protection. It is the price quoted by the people selling it.
The Fear-Price Index fell for four sessions this week and ticked back on payrolls day: 68.1 on 08.03, 67.9 on 08.04, down to 63.6 on 08.05, 61.5 on 08.06, and back to 63.4 on 08.07. One year volatility VIX1Y went from 22.90 to 22.66.
The thermometer measures one thing: what the market currently pays to insure the next year. The dearer the insurance, the more the market is afraid. A reading of 63.4 means it is dearer than on 63% of days in the past three years.
Pulling it apart is more interesting. Across the 17 watched names this week, the 30 day price of insurance fell in every single one, while at one year only 15 fell. The median change was −4.60 at the near end against −0.62 at the far end, seven times apart. In 16 of 17 names, the near end fell further than the far end.
The steepest was SanDisk: 30 day volatility went from 130.45 to 91.49, down 38.96 points in a week, while its one year figure fell only 9.98. Earnings were out and that uncertainty was gone, so short dated cover was immediately worth less. But what happens a year from now, nobody rewrites on the strength of one quarterly report.
Method: both figures are constant maturity, same source. The change is 08.07 minus 08.03.
The near end is sentiment and moves on a headline. The far end is cost. A market maker has to quote a year out. He is not guessing direction, he is calculating what he must charge to carry that risk without losing. So the far end moves slowly. One earnings report does not change his view of a year.
If you have ever bought anything with the word "principal protected" on it, a snowball note or a structured product, the long end of this curve is what prices your contract. You have never looked at it, and it has been pricing you all along.
For anyone holding the shares, the two ends of this curve are two different bills. The near end collapsing 38.96 points (SanDisk) means one month of protection cost over a third less on Friday than on Monday, and the same holder writing covered calls collects a third less rent. Cheaper insurance and thinner rent are the same fact seen from opposite sides. The far end barely moving means the market judged that one event cleared, not that the name has gone quiet.
The judgment of this section: this week's cooling was event clearing, not a general stand down. The test lives in the term structure: a genuine retreat lowers both ends, and this week only the near end fell. Void if: the one year end catches down by more than 2 points next week. That would be the market repricing long horizon risk, and this reading changes.
It says nothing about next week. It says that the people who must quote a year ahead, and who pay when they quote wrong, lowered their price this week.
Put the week's two lines side by side and they run opposite: the index climbed all week, while insuring the next year kept getting cheaper.
5. One name took a third of the week
In one line: a third of this week's flagged money sat on a single name.
Flagged premium for the week totalled $3.74 billion. SPCX alone accounted for $1.21 billion, or 32.3%, appearing 303 times. Nvidia was second at $520 million, Micron third at $400 million. One name outweighed the second and third combined.
One name taking a third means two different things to two different holders. Holding SPCX means holding the most expensively priced attention in the market: most of that $1.21 billion expires next Thursday, so for five sessions every move it makes gets amplified by option hedging, in both directions. Holding anything else carries its own note: when one name takes a third of the flagged tape, the other sixteen share what is left of the attention, and Micron's 900 line and Tesla's adjacent strikes were built in exactly that shadow.
The judgment of this section: concentration is itself information. 32.3% of $3.74 billion on one name says nothing about who the market likes. It says where the market spent its volatility budget. Void if: next week SPCX's share falls below 15% while the total holds, in which case this was an unlock week exception; if the total shrinks with it, the week's noise was one name's all along.
Method: one closing round per session, summed across five sessions. Rounds within the same day are never added together, or a market maker's turnover gets counted twice.
We lay the meaning out in full. What anyone does with it is their own account.
6. Next week: how the money declares itself
Three events land together next week: CPI on 08.12, PPI on 08.13, and the preliminary Michigan consumer sentiment reading on 08.14.
All three fall inside the life of the contracts expiring 08.14. That batch has to price three numbers at once, and it settles only once. Whatever the market quoted for that strike at the 08.07 close is its quote on how much confidence it has about all three together.
08.19 is the front month volatility futures expiry, so from next week the front month enters its final fortnight. If the curve changes shape after that, it cannot be attributed to sentiment alone. The roll has to be counted in too.
Options activity, name by name → https://chronicle.klay-wang.com/options
The thermometer and both ledgers → https://chronicle.klay-wang.com
Both pages update automatically after each close, carry their date, and cannot be edited afterwards.
本站不提供投资建议,不预测方向,不做择时。